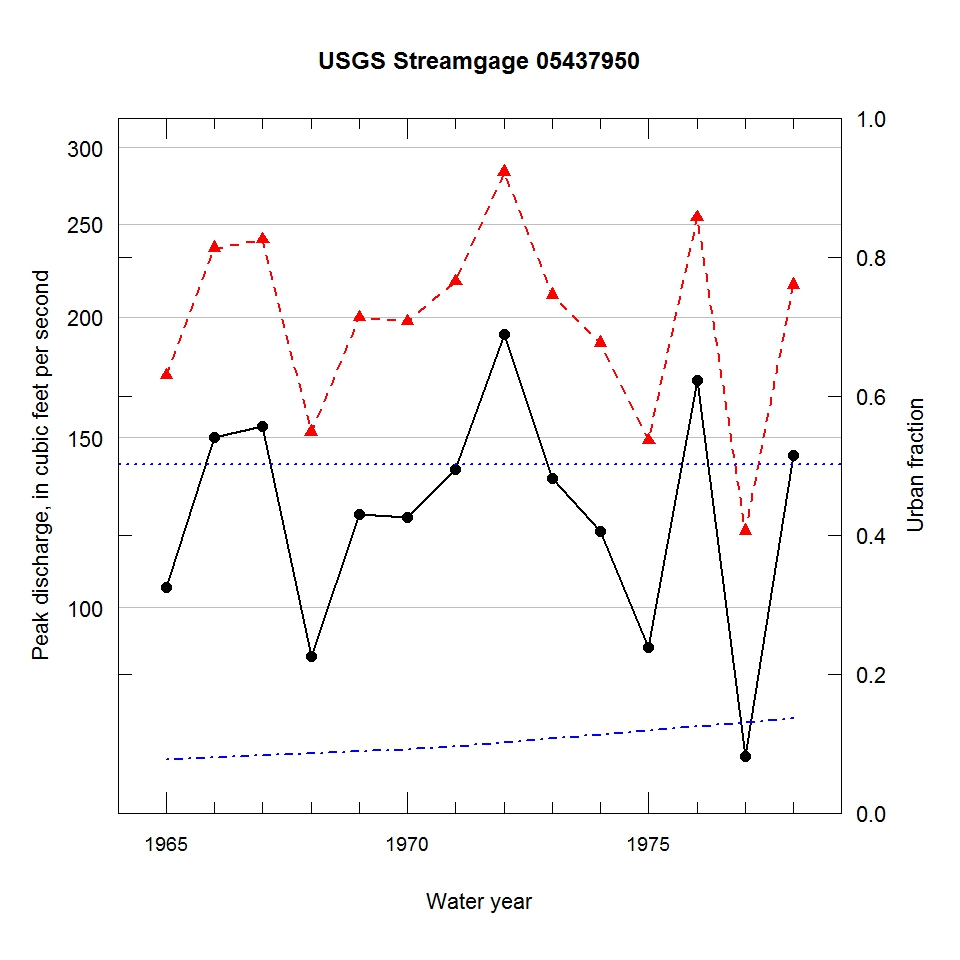
Observed and urbanization-adjusted annual maximum peak discharge and associated urban fraction and precipitation values at USGS streamgage:
05437950 KISHWAUKEE RIVER NEAR HUNTLEY, IL


| Water year | Segment | Discharge code | Cumulative reservoir storage (acre-feet) | Urban fraction | Precipitation (inches) | Observed peak discharge (ft3/s) | Adjusted peak discharge (ft3/s) | Exceedance probability |
| 1965 | 1 | -- | 0 | 0.077 | 0.061 | 105 | 174 | 0.645 |
| 1966 | 1 | -- | 0 | 0.080 | 0.512 | 150 | 236 | 0.397 |
| 1967 | 1 | -- | 0 | 0.082 | 0.920 | 154 | 241 | 0.382 |
| 1968 | 1 | -- | 0 | 0.085 | 1.296 | 89 | 152 | 0.741 |
| 1969 | 1 | -- | 0 | 0.088 | 1.366 | 125 | 200 | 0.537 |
| 1970 | 1 | -- | 0 | 0.091 | 1.559 | 124 | 198 | 0.546 |
| 1971 | 1 | -- | 0 | 0.096 | 0.427 | 139 | 218 | 0.465 |
| 1972 | 1 | -- | 0 | 0.102 | 0.696 | 192 | 283 | 0.254 |
| 1973 | 1 | -- | 0 | 0.108 | 1.560 | 136 | 211 | 0.490 |
| 1974 | 1 | -- | 0 | 0.113 | 1.139 | 120 | 188 | 0.591 |
| 1975 | 1 | -- | 0 | 0.119 | 0.033 | 91 | 149 | 0.752 |
| 1976 | 1 | -- | 0 | 0.124 | 1.295 | 172 | 254 | 0.339 |
| 1977 | 1 | -- | 0 | 0.130 | 0.821 | 70 | 120 | 0.854 |
| 1978 | 1 | -- | 0 | 0.136 | 1.463 | 144 | 216 | 0.471 |

